|
Home \ Instrumentation \ Antenna
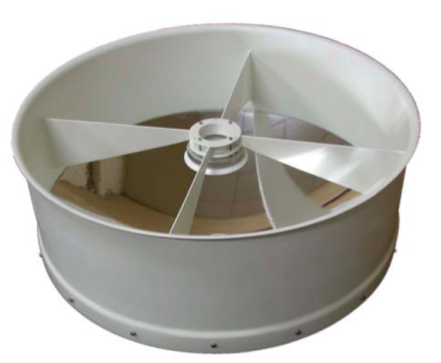
Antenna Dish60 cm antenna
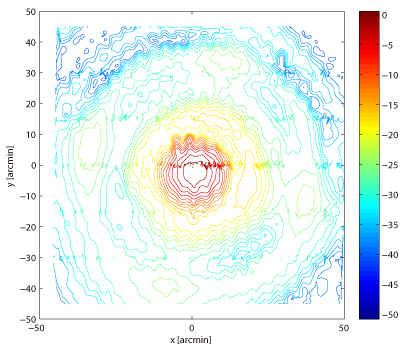
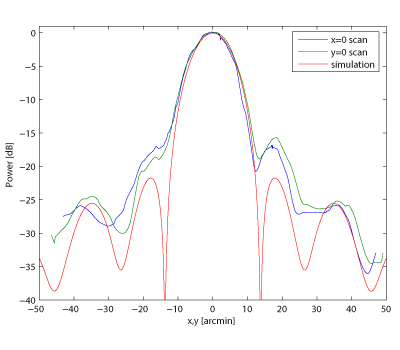
The antenna optics adopt a Cassegrain reflector dish illuminated by a circular corrugated feed horn. There are two sizes of antenna dishes used to expand the array's image and configuration capability. The seven-element array used 0.6m diameter primary reflectors, and the current thirteen-element array uses 1.2m dishes. The two sizes of dishes share the same feed horn and have the same focal ratio which simplifies designs. Similar to the CBI design, the mirror assembly is equipped with a rolled-edge baffle around the primary dish extending just above the secondary mirror. This absorptive baffle lowers cross-talk from adjacent dishes. The following photos shows a 0.6m dish. The optics is designed such that the secondary mirror is illuminated by a Gaussian beam with -10.5dB edge taper. The measured beam pattern of the 0.6m dish has FWHM= 23' and its first sidelobe level -20dBc peaked around 37'. The numbers are in good agreement with a simple centrally blocked Gaussian illumination beam pattern. Although it is not required, the primary mirror has been polished and coated to near optical quality. 1.2m antennaThe 1.2m dish far-field beam pattern was measured with a computer-controlled equatorial mount, scanning a fixed 90 GHz thermally stabilized CW source at a distance of about 250-300m. An example of a measured beam pattern from a 2-dimensional scan is shown in Figure 1. A cross-like feature likely resulting from the four legs of the secondary mirror support structure becomes apparent, with an increase in power of about 1dB at the location of the second sidelobe. Figure 2 compares two orthogonal scans across the main beam center with the expected theoretical simulation result for the E-plane at 95 GHz. From the measurement, a FWHM of about 11 arcmin is found with a first sidelobe peaking at about -16 to -18dB.
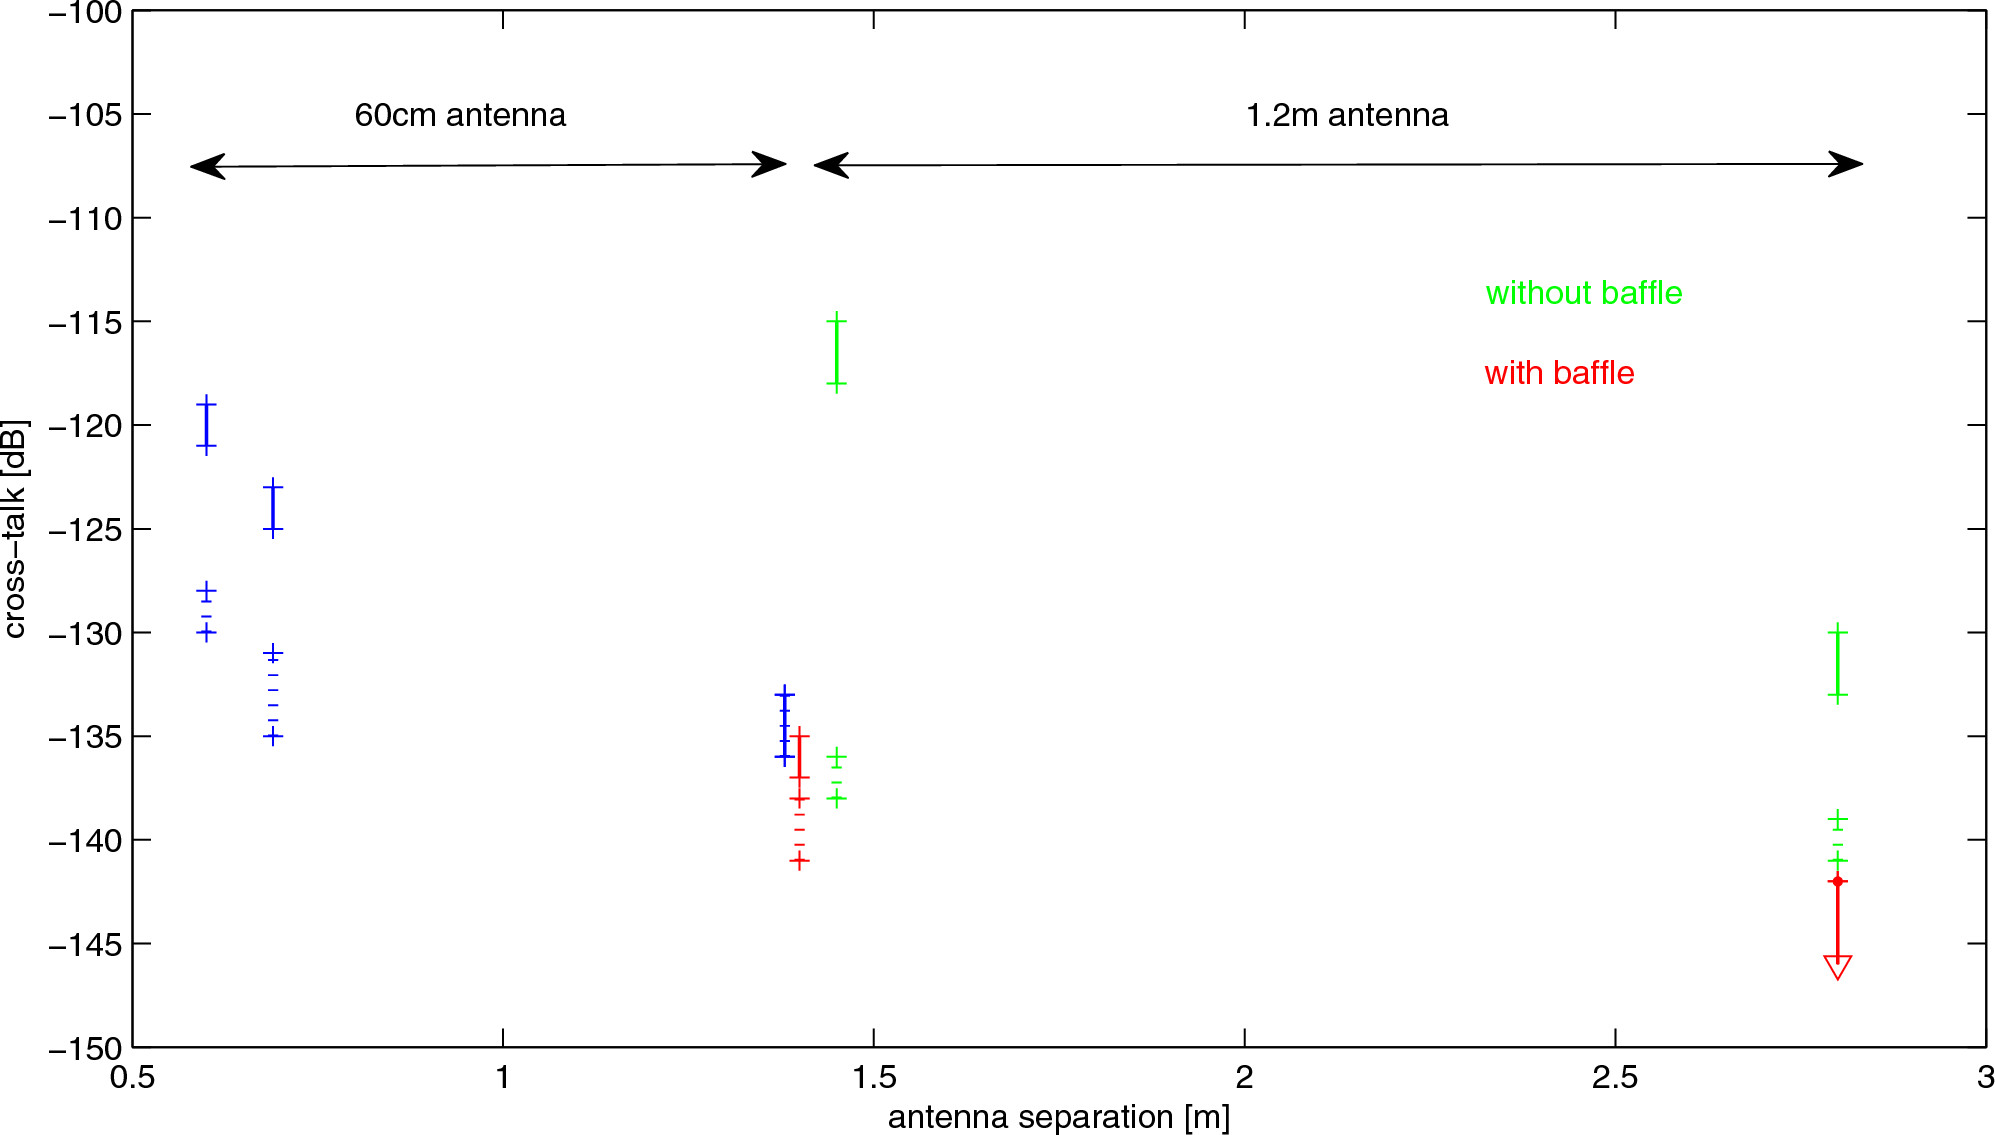
Low antenna cross-talk signals were verified on the operating 13-element array on the YTLA (formerly AMiBA) site. As a measurement set-up, one antenna served as an emitter and was outfitted with a 10dBm narrow-band polarized source (Gunn oscillator with a bandwidth of about 2-3 MHz around 5.56 GHz). In different adjacent antennas (dual linear polarization receivers) the weak cross-talk signal was then detected with a spectrum analyzer connected to the output at the end of the first section in the intermediate frequency (IF) chain. Various amplifiers along the IF chain (from the receiving feedhorn to the end of the first section) give rise to a gain of about 70 dB Subtracting that and taking into account the source power, the original cross-talk signal scattered into the feedhorn is derived. The coupling between two 1.2m antennas was measured for a 1.4m and a 2.8m baseline. In order to quantify the influence of the shielding baffle, the measurement was done with and without baffle. Figure 3 summarizes the results. For comparison, the smaller 60~cm antennas were also checked on a few baselines. The shielding baffle reduces significantly the maximum cross-talk signal from about -115dB to -135dB or less on the 1.4m baseline, and from -130dB to -145dB or less on the 2.8m baseline (Koch et al., 2011, PASP, 123, 198).
|
>> ASIAA

© Institute of Astronomy and Astrophysics, Academia Sinica, All Rights Reserved.
Contact: web asiaa.sinica.edu.tw | Privacy and Security Policy
Contact: web